


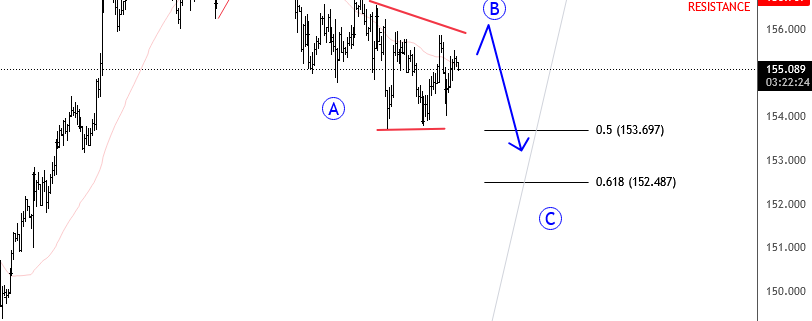
Hello Traders! It’s been a few weeks since our latest Elliott wave blog post.
Stocks haven’t made much progress since early December, and the S&P 500 is still consolidating. This was initially due to portfolio adjustments and profit-taking at the end of 2024. Now, we’re seeing limited upside as the Fed has decided to stay on hold with rates, and new risks related to tariffs and trade wars have emerged. From an Elliott wave perspective, this appears like a correction within uptrend.
Read more
The USD/JPY is attempting to break below the ascending wedge formation today, a pattern that has been in play since late summer. This wedge has provided structural support for the pair’s upward movement, but a decisive break to the downside would signal a notable shift in market sentiment, turning the outlook bearish.
The EUR/USD has encountered resistance at the descending channel’s trendline near 1.0425, following yesterday’s strong rebound. This channel has defined the pair’s downward trajectory since last August, underscoring its technical significance.
The NASDAQ has spent the last 1.5 months consolidating in a symmetrical triangle. We are currently testing the triangle’s T/L resistance.
The NASDAQ 100 reversed lower after first creating a short term overthrow to the ascending wedge. This is something we often see happen in wedge formations, first trapping the bulls (or bears) and then reversing in the other direction with momentum.