Impact of U.S. Elections on Forex Markets: Analyzing Dollar Surge and JPY Pairs

U.S. elections impact on forex markets

In the wake of the U.S. elections, the DXY surged, significantly impacting dollar-related forex pairs. This analysis focuses on the dollar’s immediate reaction and its potential effects on various Japanese currency pairs.

Read more

Abstract image symbolizing silver market dynamics, with charts and graphs.

Exploring Silver’s Recent Performance: Insights by André Cardoso at Forex Analytix

In the fast-paced realm of financial markets, silver has recently made significant waves that are crucial for traders and investors to capitalize on. This blog post delves deep into silver’s recent performance, shedding light on key technical indicators and their implications for informed market participants.

Silver’s Recent Breakout and Momentum

Silver has shown impressive bullish momentum after breaking through the stubborn resistance level at $32.95. This breakout has set the stage for a potential uptrend, fueled by strong buying activity.

Silver shows impressive bullish momentum after breaking through stubborn resistance at $32.95.

Navigating Overbought Conditions and Historical Patterns

Since October 11th, silver has been consistently in overbought territory. It’s important to note that similar instances in the past have often preceded downward corrections, as evidenced in the corrections observed in August and September.

Silver has been in overbought territory since October 11th, historically preceding downward corrections.

Animated GIF showcasing coaching sessions for traders at ForexAnalytix.

Fibonacci Extensions and Support Levels

Silver is currently approaching the 161.8% Fibonacci extension from its recent low between October 4th and 8th, which experienced an 8.65% decline. Subsequently, the market reacted positively, nearing the formation of a potential bearish crab pattern.

Identifying Potential Bearish Signals

Watch for signs of the bearish crab pattern forming around the $34.72 mark. This pattern could signal a shift in silver’s recent upward trend, potentially leading to a retracement towards previously breached major resistance levels, particularly around $32.51.

Silver approaches 161.8% Fibonacci extension from October 4th-8th, hinting at support at $30.10.

Strategic Moves for Savvy Investors

For long-term investors, the former resistance level, now acting as support at $32.51, is a critical focal point. Monitoring this level closely can guide strategic decisions on position adjustments and navigating the silver market effectively.

Chart showing former resistance level at $32.51, now acting as critical support for long-term investors in the silver market.

While the breakthrough at $32.95 is optimistic, caution is advised given the overbought conditions and historical patterns suggesting potential corrections. It’s crucial to remain vigilant regarding key support levels around $33.43 and the prior resistance level at $32.51 to anticipate silver’s future direction.

traderfunding

Staying well-informed and utilizing technical analysis wisely empowers us to identify opportunities and manage risks effectively in the silver market.

Click here to subscribe with ForexAnalytix and stay updated as the market continues to evolve.

Happy Trading,
André Cardoso at Forex Analytix

Cover image for swing trading article featuring harmonic patterns analysis

Swing Trading with Harmonic Patterns at Forex Analytix

Welcome to this week’s market digest, where we uncover the nuances of recent asset performances across diverse financial domains. Our exploration covers everything from the forex arena and commodities to equities and digital currencies, offering a panoramic view of market dynamics. This briefing is tailored to furnish traders and investors with essential intelligence and strategic insights, helping them steer through the shifting market currents. Discover the latest developments—from critical support tests in the US Dollar Index (DXY) to intriguing pattern formations in various assets—empowering you with the knowledge needed for astute decision-making.

(video version at the bottom)

Read more

USDCAD forex pair technical analysis chart showing key support and resistance levels with Banksy-inspired street art elements

Harmonic Pattern Analysis: Key Levels and Scenarios || USDCAD

In the world of technical analysis, few tools offer the predictive power of harmonic patterns combined with Fibonacci retracement and extension levels. In April 2016, I identified what I termed as “The Mega Harmonic” pattern for the USDCAD currency pair on a monthly timeframe. This USDCAD harmonic pattern analysis predicted a significant downward move—approximately 14%—towards 1.2541, which aligned with the 38.2% Fibonacci retracement level. By June 2021, the pair hit a low of 1.200, closely following the projection. Since then, the pair has shown signs of recovery but has been trapped in a consolidation phase since October 2022.

Read more

Graph showing analysis of JPY Forex pairs with focus on consolidation and potential bearish trend.

JPY Forex Pairs Technical Analysis: Will the Downtrend Continue?

In today’s video, we’ll dive into the latest developments in the JPY-related Forex pairs. Based on recent technical analysis, we might be entering an extended period of consolidation above the latest fractal support. However, weekly time-frame patterns indicate a potential downward movement in the medium-long term. It’s essential to monitor these pairs closely, as projections point to lower price targets.

Check out the full analysis in the video below.

Check our previous analysis here

To further enhance your understanding of the Forex market and refine your trading strategies, I recommend exploring the following resources:

  • Trader Coach: Find tips and strategies to improve your trading approach.
  • Trader Funding Program: Discover funding opportunities for traders and advance your career.
  • Forex Analytix: Access advanced analysis and tools to optimize your trading decisions.

Check out these sites for valuable insights and tools that can support your journey in the Forex market.

Risk Warning: Trading financial assets carries a high level of risk and may result in the loss of all your capital. Make sure to fully understand the risks involved before you start trading and carefully consider your investment objectives, level of experience, and risk tolerance. The data and information provided in this content do not constitute financial or investment advice and should not be considered as such. Only invest what you can afford to lose, and be aware of the risks associated with trading financial assets.

USDJPY Technical Analysis and Economic Impact July 2024

USDJPY currency chart with key technical analysis and economic events for July 2024.

Technical Analysis:

In this article, we examine the recent technical patterns of USDJPY and consider how upcoming economic events in July 2024 might affect the market. We’ll look at recent price movements and key indicators to better understand potential changes in the currency pair.

The USDJPY currency pair has recently tested historic highs, revisiting levels last seen in April 1990. The pair reached a peak of 160.16 before establishing a new fractal resistance at 161.95. Presently, USDJPY appears to be signaling a potential pullback, influenced by technical patterns and economic indicators that merit close examination.

The technical analysis reveals critical support and resistance levels. Understanding the technical patterns can provide insights into potential market movements, especially with the economic impact of upcoming data this week.

Read more

Countdown to Interest Rate Decision

japanese-yen-technical-analysis-2024

japanese-yen-technical-analysis-2024 by forexanalytix

Investors worldwide are on edge as anticipation builds around the imminent interest rate decision scheduled to unfold in just hours. The outcome of this pivotal announcement promises to send ripples through global financial markets, impacting currencies and equities alike. As market participants brace for potential shifts in monetary policy, meticulous analysis and strategic foresight become paramount.

Read more

forexanalytix

Cryptocurrency Technical Analysis

Exploring Technical Performance: Analysis of Key Cryptocurrencies

Welcome to our latest blog post where we explore the technical performance of 4 cryptocurrencies in the market.

As traders and investors, staying informed about market trends and potential price movements is crucial for making strategic decisions. In this analysis, we focus on four major cryptocurrencies—Cardano (ADA), Avalanche (AVAX), Polkadot (DOT), and Binance (BNB)—highlighting critical support levels, potential patterns, and projection scenarios. Understanding these technical indicators will help you anticipate market shifts and optimize your trading strategies. Let’s delve into the detailed technical studies of these assets.

Cardano (ADAUSD)

Currently, Cardano is showing a bearish outlook with a support level at 0.4011 acting as the neckline for a head and shoulders pattern, as well as a consolidation/support within a bearish flag pattern. A breach below this support could see prices decline towards 0.2791, as indicated by the flag pattern, or potentially further to 0.1587, based on head and shoulders default projections, which is below the June 2023 lows of 0.2160.
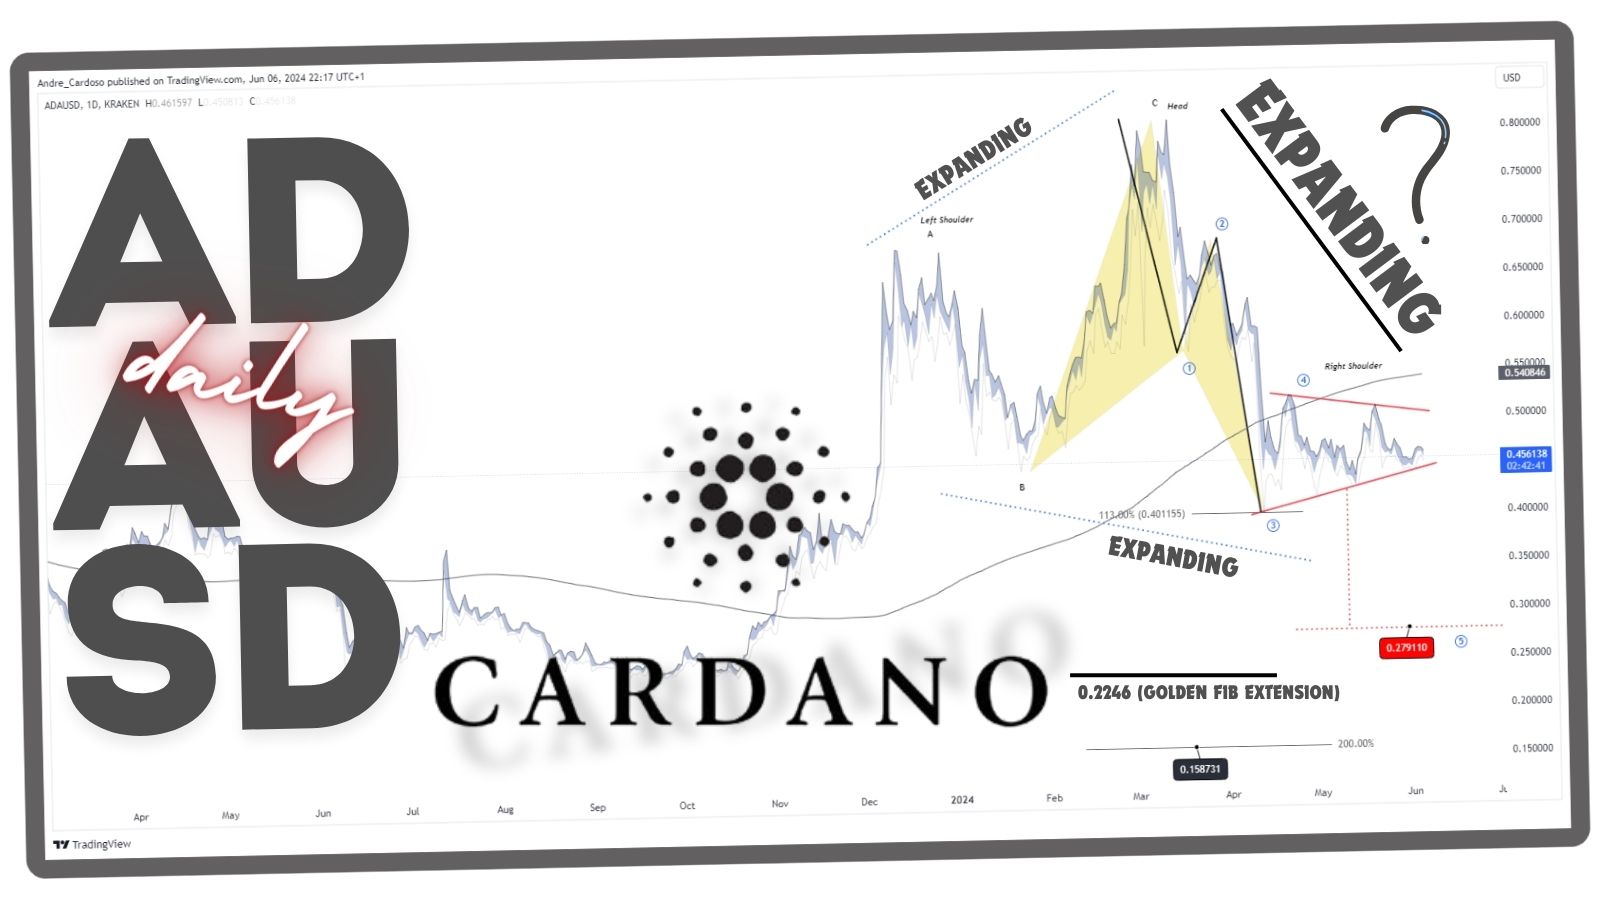
technical chart cardano

Avalanche (AVAXUSD)

Similar to Cardano, Avalanche is also exhibiting a head and shoulders pattern with a critical support level at 27.21. A breakdown below this level could trigger declines to the October 2023 lows or further down to 2.45, based on the default projections of the head and shoulders pattern.


technical chart avalancheTrader Coach

Polkadot (DOT)

Polkadot is displaying another bearish scenario with a head and shoulders pattern and a support level at 5.77. A drop below this support could lead to a return to the October 19 lows or potentially to 1.26, as per head and shoulders projections. Additionally, a bearish flag pattern suggests a target of 3.80, which is still above the October support.

technical chart polkadot

Binance (BNBUSD)

Contrary to the previous assets, Binance has shown bullish momentum, recently testing the historic highs of May 2021 at 693.4. This upward movement could see a retracement to the Fibonacci level of 526, representing a 38.2% retracement from its recent peak.

binance technical analysis criptocurrencies

Thank you for taking the time to read our technical analysis. We hope these insights prove valuable in your trading and investment decisions. Stay tuned for more updates and analyses to help you stay ahead in the ever-evolving market. Your support and engagement are greatly appreciated. For more detailed information and continuous updates, be sure to visit us at Forex Analytix.

Happy Trading
André Cardoso

Technical Analysis Forex analytix

Analysis of Global Assets in 2024

In the ever-evolving world of finance, understanding the intricate dynamics that shape market trends is paramount

As we progress through 2024, a thorough examination of key financial instruments reveals a complex interplay of monetary policies, economic fundamentals, and market sentiments. This comprehensive analysis offers insights into the trajectories of major assets, providing investors with a roadmap in these uncertain times. Stay ahead of the curve with our exclusive updates on financial market analysis 2024, tailored for traders and investors seeking strategic advantages.

Read more

superconductor

A Glance at $ACLS and the Journey of Superconductors

Axcelis Technologies, Inc. is a prominent player in the semiconductor chip manufacturing industry, specializing in the production of capital equipment.