Posts

(Elliott Wave) Scanning the Big Cycles: What to Watch on Stocks and the Dollar in 2026

Good day to everyone, and to all readers of ForexAnalytix.com. As you know, at the beginning of each year I always scan some higher degree time frame charts to look at the bigger cycles, so we can understand what to expect and what to be aware of rather than being surprised. If you were reading our work a year back, that was when I highlighted that the S&P 500 could see a pullback into the first half of 2025, before the market could stabilize and the dollar could resume lower. Read more
Fed Decision in Focus: Dollar Index at a Turning Point as Markets Brace for Powell

Dear Traders and FA Members,

Unfortunately, I won’t be able to join today’s live FACE webinar, but because of the importance of the Fed decision later today, I felt it was necessary to share a quick update here in this blog post.

If you have been following our recent webinars with Dale, you know that I have been highlighting a wedge formation on DXY that developed from the September lows. In Elliott Wave terms, this wedge can represent either an ending diagonal of an A-B-C correction or even a leading diagonal of a new bullish trend. What matters is that in both scenarios, I was looking for a reversal from above the 100 area on the Dollar Index — and now we can see that the wedge has been broken, which signals more weakness ahead. Read more

Elliott Wave Analysis: SP 500 Can Look For Deeper Correction After Relief Rally, as Key Support Levels Break

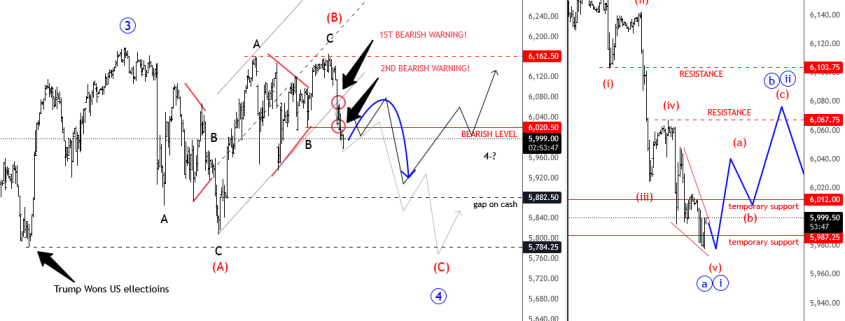
The US stock market turned sharply lower last week following weak US economic data. On Friday, the S&P 500 moved toward its channel support from January 12th, but since that channel was broken, along with the 6020 swing support, we now have important warning signals, suggesting a more complex correction is unfolding and that pause on stocks will be a bit longer. More weakness can follow after a relief rally. Read more

EDGE chart of the day

EDGE Chart of the Day – DXY – (February 24th, 2025)

The DXY is testing a key confluence zone at 106.35, where the descending wedge trendline support aligns with the 38.2% Fibonacci retracement of the last bullish leg. This level is pivotal in shaping the next trend direction.

EDGE chart of the day

EDGE Chart of the Day – Silver – (February 18th, 2025)

Silver continues to test the key $32.50 resistance level, a pivotal area that has held firm over the past couple of weeks. So far, bulls have struggled to break through, leaving two potential scenarios moving forward:

EDGE chart of the day

EDGE Chart of the Day – SPX500 – (February 17th, 2025)

The S&P 500 (SPX) is breaking higher once again, pushing into uncharted all-time high (ATH) territory. The next upside target stands at 6,193, which corresponds to the 127% Fibonacci extension of last year’s pullback.

Elliott Wave Update: Stocks in Wave 4 Consolidation, Dollar Reversal Ahead

Hello Traders! It’s been a few weeks since our latest Elliott wave blog post.

Stocks haven’t made much progress since early December, and the S&P 500 is still consolidating. This was initially due to portfolio adjustments and profit-taking at the end of 2024. Now, we’re seeing limited upside as the Fed has decided to stay on hold with rates, and new risks related to tariffs and trade wars have emerged. From an Elliott wave perspective, this appears like a correction within uptrend.
Read more

EDGE chart of the day

EDGE Chart of the Day – Crude Oil – (November 15th, 2024)

Crude is testing a T/L support that has been holding since September. Between this and the L/T channel’s T/L resistance WTI is trapped in a symmetrical triangle.

EDGE chart of the day

EDGE Chart of the Day – AUDCAD – (November 14th, 2024)

The AUDCAD has been trading in an ascending channel during the past 14 months. We are currently facing the probability of a bearish breakdown.