Posts

(Elliott Wave) Scanning the Big Cycles: What to Watch on Stocks and the Dollar in 2026

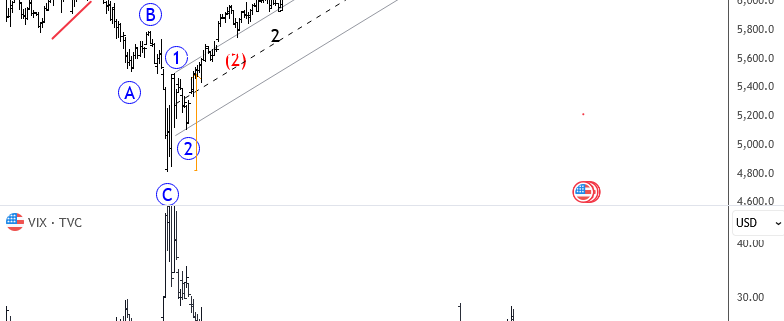
Good day to everyone, and to all readers of ForexAnalytix.com. As you know, at the beginning of each year I always scan some higher degree time frame charts to look at the bigger cycles, so we can understand what to expect and what to be aware of rather than being surprised. If you were reading our work a year back, that was when I highlighted that the S&P 500 could see a pullback into the first half of 2025, before the market could stabilize and the dollar could resume lower. Read more
Elliott Wave: Dollar at Risk Ahead of CPI and Fed Cut

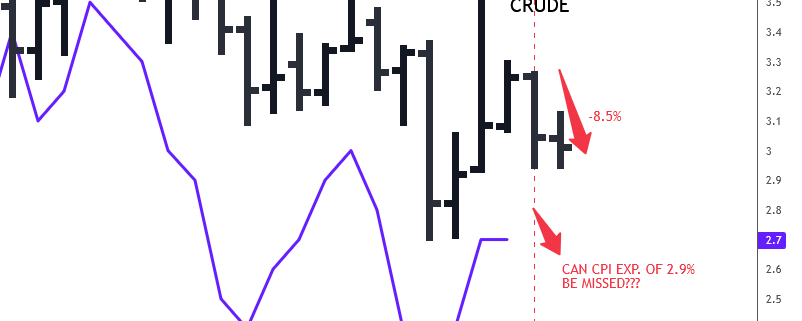
Hello everyone, it’s been some time since I shared a free Elliott Wave post here for Forex Analytix readers. The reasoning is simple: we have been trapped in this range for the last two months, if not more, so the dollar is still not going anywhere. My assumption, however, is that the range could be broken to the downside. How far the dollar can actually drop is yet to be discovered, but I’m looking for a potential breach below the July lows to complete an ending diagonal, and then maybe see a reversal later on. Read more

EDGE chart of the day

EDGE Chart of the Day – DXY – (February 24th, 2025)

The DXY is testing a key confluence zone at 106.35, where the descending wedge trendline support aligns with the 38.2% Fibonacci retracement of the last bullish leg. This level is pivotal in shaping the next trend direction.

EDGE chart of the day

EDGE Chart of the Day – Silver – (February 18th, 2025)

Silver continues to test the key $32.50 resistance level, a pivotal area that has held firm over the past couple of weeks. So far, bulls have struggled to break through, leaving two potential scenarios moving forward:

EDGE chart of the day

EDGE Chart of the Day – SPX500 – (February 17th, 2025)

The S&P 500 (SPX) is breaking higher once again, pushing into uncharted all-time high (ATH) territory. The next upside target stands at 6,193, which corresponds to the 127% Fibonacci extension of last year’s pullback.

EDGE chart of the day

EDGE Chart of the Day – USDJPY – (January 27th, 2025)

The USD/JPY is attempting to break below the ascending wedge formation today, a pattern that has been in play since late summer. This wedge has provided structural support for the pair’s upward movement, but a decisive break to the downside would signal a notable shift in market sentiment, turning the outlook bearish.

EDGE chart of the day

EDGE Chart of the Day – GBPUSD – (January 24th, 2025)

The GBP/USD (Cable) has been rebounding from recent lows over the past several days and is now testing the descending channel’s trendline resistance at 1.2440—a critical pivot level for the pair.

EDGE chart of the day

EDGE Chart of the Day – EURUSD – (January 21st, 2025)

The EUR/USD has encountered resistance at the descending channel’s trendline near 1.0425, following yesterday’s strong rebound. This channel has defined the pair’s downward trajectory since last August, underscoring its technical significance.

EDGE chart of the day

EDGE Chart of the Day – Nasdaq – (January 20th, 2024)

The NASDAQ has spent the last 1.5 months consolidating in a symmetrical triangle. We are currently testing the triangle’s T/L resistance.