
Update On Precious Metals
I wrote a blog post on Precious Metals in June 2025, outlining their recent performance and outlook.


I wrote a blog post on Precious Metals in June 2025, outlining their recent performance and outlook.
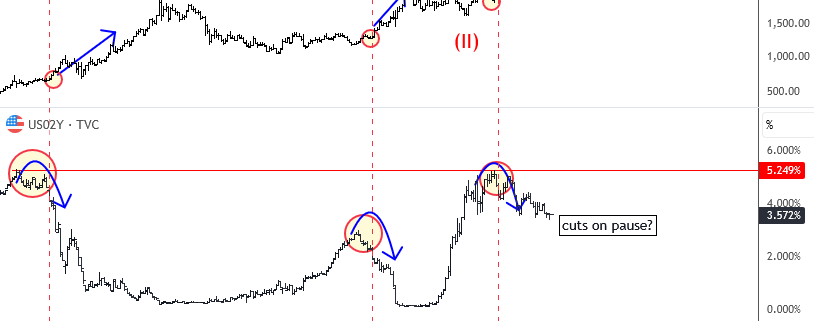
From an Elliott Wave perspective gold seems like it may try to complete an extended wave three, and put wave four pause in play. But what can trigger a retracement?
So far, 2025 has been a year where Precious Metals have been very much in focus.

The DXY is testing a key confluence zone at 106.35, where the descending wedge trendline support aligns with the 38.2% Fibonacci retracement of the last bullish leg. This level is pivotal in shaping the next trend direction.
Silver continues to test the key $32.50 resistance level, a pivotal area that has held firm over the past couple of weeks. So far, bulls have struggled to break through, leaving two potential scenarios moving forward:
The S&P 500 (SPX) is breaking higher once again, pushing into uncharted all-time high (ATH) territory. The next upside target stands at 6,193, which corresponds to the 127% Fibonacci extension of last year’s pullback.
The USD/JPY is attempting to break below the ascending wedge formation today, a pattern that has been in play since late summer. This wedge has provided structural support for the pair’s upward movement, but a decisive break to the downside would signal a notable shift in market sentiment, turning the outlook bearish.
The GBP/USD (Cable) has been rebounding from recent lows over the past several days and is now testing the descending channel’s trendline resistance at 1.2440—a critical pivot level for the pair.
The EUR/USD has encountered resistance at the descending channel’s trendline near 1.0425, following yesterday’s strong rebound. This channel has defined the pair’s downward trajectory since last August, underscoring its technical significance.